60 Reasons to Protest: Reason #14 – Misleading Noise Data
The community protests at Sydney Airport in the mid nineties led not only to the introduction of a curfew, movement cap, and Long-Term Operating Plan, they also caused various inquiries and reports to be produced assessing how to learn from the mistakes made back then. Did Brisbane Airport Corporation and Airservices Australia learn their lesson at the time? No, they did not. Here is why:
Three Commonwealth Government reports stand out when it comes to identifying ways to improve how aircraft noise data is presented to communities:
Some notable quotes:
The generation of an ‘anti airport’ resident as a result of a perception of misleading information can arise in a number of ways. In particular, from data issued during the environmental assessment process for a new project (eg new runways or flight path arrangements) or from advice given to a person moving into a new house which is in an area where there is existing audible aircraft noise.
The circumstances surrounding the EIS for the third runway at Sydney Airport are a prime example of the first case. Many people claim that they did not object during the EIS process because the ANEF information led them to believe that they would not be affected by the project. […] If they then decide to proceed with the house move, but armed with full information, experience is that they are less likely to become an ‘anti airport activist’ if they subsequently hear aircraft noise after they have moved in to the new home.
Expanding Ways to Describe and Assess Aircraft Noise, March 2000, pp. 48-49
Polluters have a responsibility to monitor and report on the pollution they are generating and the public has a right to know environmental pollution levels. It is self evident that if pollution levels are reported in a manner that is unintelligible to the non-expert there has not been effective disclosure of what is happening.
Our experience in recent years has shown that if a meaningful picture is to be painted of aircraft noise exposure patterns around an airport a person needs, at the least, to have access to the following information:
- where the flight paths are;
- at what times aircraft use a flight path (in particular sensitive times – night/early morning, evenings and weekends);
- how often aircraft use the flight path;
- variations in activity levels from hour to hour, day to day, week to week, etc; and noise levels from individual flights.
It is considered best practice that every citizen has a ‘right to know’ this information if they so wish.
It is important that this information be made available in a disaggregated form and that, as far as possible, it be left unadjusted. That is, the detail should not be buried in an average day noise contour nor should information on what happens at sensitive times be hidden by the use of weightings. It is also important that the information cover areas which extend far beyond the 20 ANEF contour.
Guidance Material for Selecting and Providing Aircraft Noise Information, July 2003, p. 5
Despite these government reports and guidelines being published well before the 2007 EIS/MDP was written and submitted by Brisbane Airport Corporation and Airservices Australia, their noise forecast data continued to be flawed and misleading for several reasons.

Decibels
Decibels (dB) are a unit used to measure the intensity or loudness of sound. Noise perception varies subjectively among individuals due to factors like personal sensitivity and context. Relying solely on decibels to convey noise pollution has flaws because it fails to capture the full range of human reactions and sensitivities to different noise volumes and the frequency of noise events. Additionally, the decibel scale is logarithmic. For example, an increase from 60 dB to 70 dB represents a tenfold increase in intensity.
The limitations of the noise modelling software
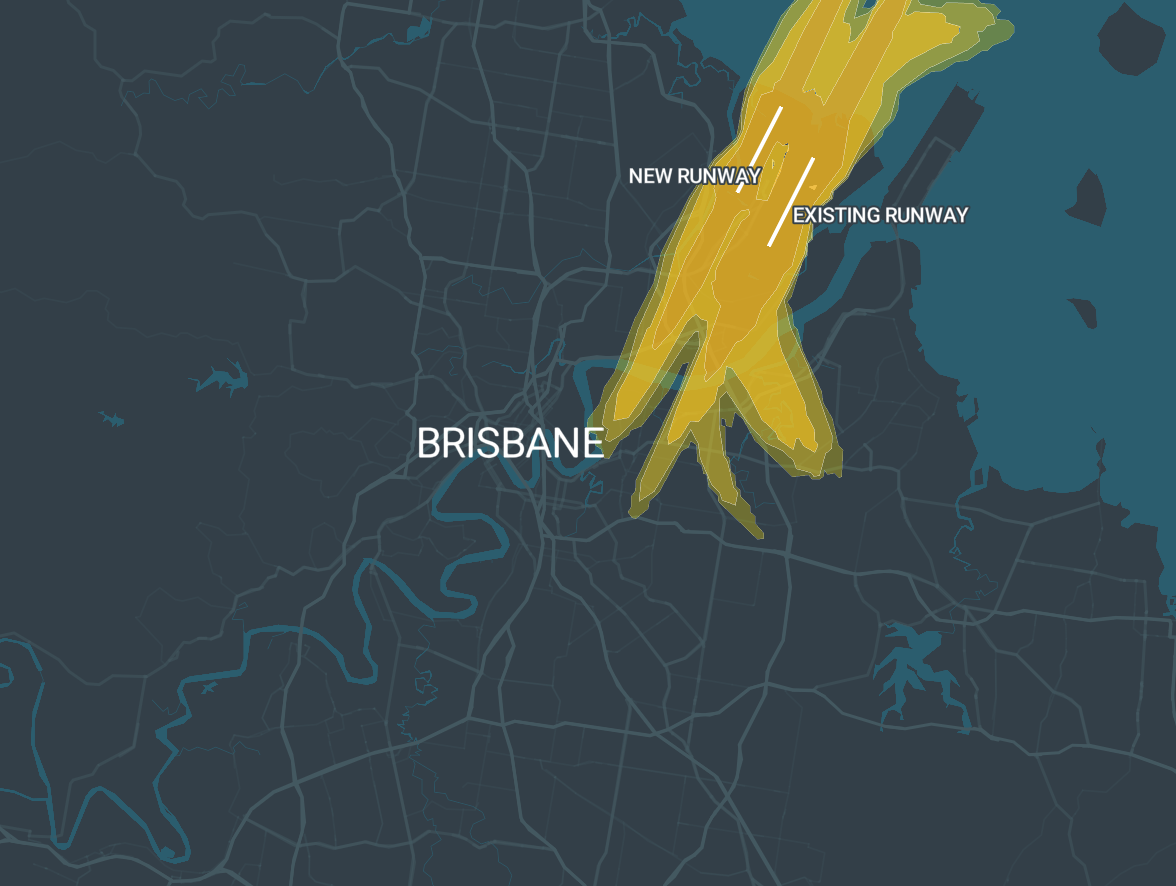
Integrated Noise Model (INM) was an aircraft noise modelling software package produced by the US Federal Aviation Administration. The first version of INM was developed in the late 1970s. As per page D5-158, the noise pollution impacts in the 2007 EIS/MDP were calculated using INM based on preset aircraft operational data such as preliminary flight paths (flight paths were not finalised until 2019/2020), aircraft types, runway modes (yet, SODPROPS mode was later removed from 6am – 10pm), etc. to compute noise contours (e.g., ANEF and N70) for areas surrounding airports.
INM had several flaws, including outdated algorithms and limitations in accurately modelling complex airport configurations such as the Brisbane aerodrome. The software failed to account for real-world conditions, such as varying atmospheric conditions and topography (e.g., Upper Brookfield and Samford Valley). Consequently, it often underestimated the actual noise impact experienced by communities surrounding airports. As a result of these flaws, INM has been phased out and replaced by more advanced tools like the FAA’s Aviation Environmental Design Tool (AEDT). AEDT addresses the shortcomings of INM by incorporating improved modelling techniques, enhanced data sources, and considering various operational factors to provide more accurate noise assessments.
Using averages to artificially lower the noise forecasts
The 2007 MDP/EIS uses “Mean Measured LA Maximum Noise Levels” (see Volumes D4 and D5). What does that mean? This data refers to the average of the highest noise levels measured over a specific period of time, as per the INM user’s guide:
INM is not designed for single-event noise prediction, but rather for estimating long-term average noise levels using average input data. Comparisons between measured data and INM calculations must be considered in this context.
Integrated Noise Model (INM) Version 7.0 User’s Guide, Report No. FAA-AEE-07-04, US Department of
Transportation, Federal Aviation Administration, Office of Environment and Energy, Washington DC, 2007, p. 13
The Community Aviation Alliance Australia (CAAA) explains that, “the true value of such contours in informing the community as to the full extent of any adverse noise impact may be significantly understated” (p. 45). CAAA offer the following graph, which illustrates the true maximum noise level that results from a single over-flight.
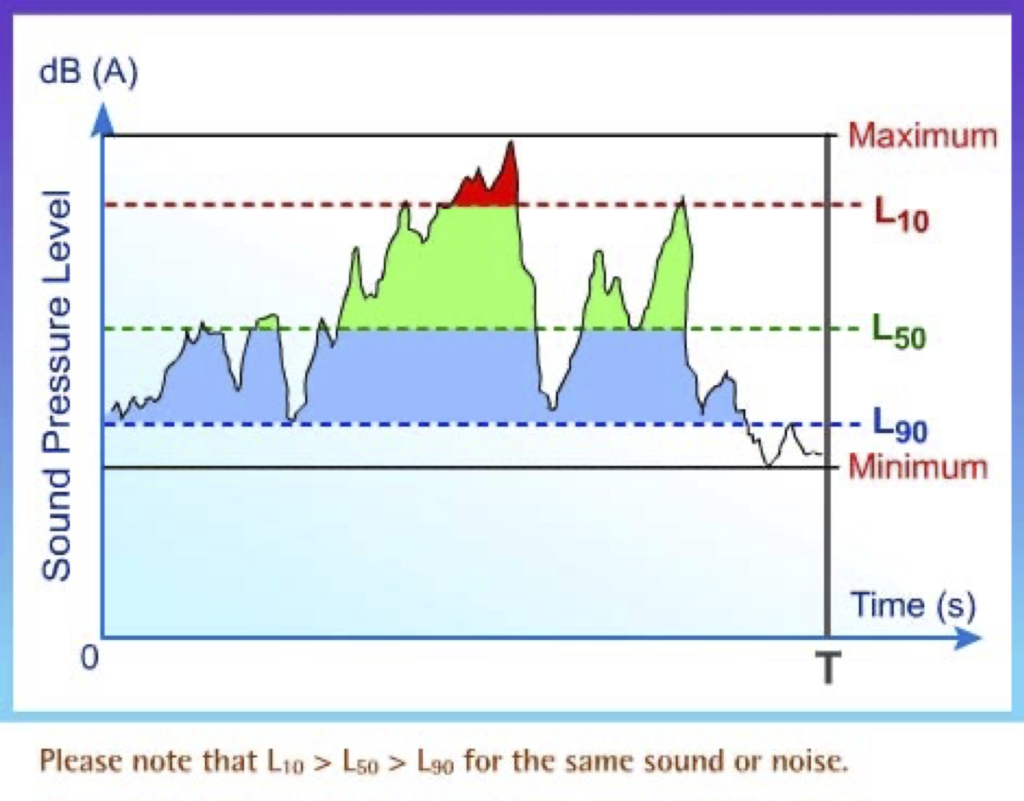
CAAA explain that, “the true range of maxima is shown by the red shaded area. The horizontal dotted line described as L10 shows the average but not the highest individual value. That value is the true LAmax resulting from the over-flight (or similar event)” (p. 46).
The flaws with ANEFs – Aircraft Noise Exposure Forecasts
BAC’s Master Plan and noise information pamphlets still largely rely on ANEF contours. BFPCA argues that using the flawed and outdated “Aircraft Noise Exposure Forecast” (ANEF) approach to model noise contours – while required under the Airports Act 1996 – is not sufficient to inform the community of what is in store for them, and this has been known since 2003:
“… these [ANEF] contours do not normally show a picture of current or near-term noise exposure patterns around an airport. Experience has shown these contours, which are based on logarithmically averaged ‘annual average day’ aircraft noise energy, do not portray noise in a way that the non-expert can readily relate to. Given the above, land use planning contours such as ANEFs are not considered suitable for use as an aircraft noise information tool.”
Guidance Material for Selecting and Providing Aircraft Noise Information, July 2003, p. 7
Residential development is only deemed “acceptable” outside the ANEF 20 contour, which represents an average noise exposure level of 20 aircraft noise events per day. Residential developments located within or near the ANEF 20 contour are typically subject to additional planning assessments and mitigation measures to manage the potential noise impacts on future residents. For example, near the proposed Western Sydney Airport new residential developments will not be permitted where the ANEF exceeds 20. However, the term “acceptable” itself is questionable as this quote explains:
In the first instance it is considered important that the wording ‘acceptable’ and ‘unacceptable’ in the [ANEF] Standard be replaced by more objective terms such as ‘no building restrictions’ or ‘building not permitted/recommended.’ As discussed at a number of points in this paper, what is considered to be ‘acceptable’ by the Standard is not necessarily ‘acceptable’ to the individual.
Expanding Ways to Describe and Assess Aircraft Noise, March 2000, p. 55
The Australia Government in its 2016 National Airports Safeguarding Framework suggested again that the ANEF approach is flawed:
“Experience has shown a range of problems with relying solely on the ANEF as a noise information tool as there are limitations in using the ANEF to describe aircraft noise exposure to laypeople.
National Airports Safeguarding Framework, Guideline A: Measures for Managing Impacts of Aircraft Noise, Attachment 1 – Supplementary Aircraft Noise Metrics, 2016, p. 1
While the populations with the highest aircraft noise exposure often live within the 20 ANEF contour, experience shows the majority of noise complaints that are received come from residents living outside the 20 ANEF contour. Traditionally the residents of these areas have been given little information on aircraft noise through the ANEF system other than that the area is considered ‘acceptable’ for housing. Some people living outside the 20 ANEF contour have been given an expectation of receiving little or indeed no aircraft noise and as a consequence find the levels of noise actually experienced to be unacceptable.
[…] land use planning could be improved through recognition that aircraft noise does not suddenly stop at the 20 ANEF contour.”
Yet, land use planning policies in states and territories as well as the current “manner of endorsement” of ANEFs approved by the Minister of Infrastructure and Transport in April 2017 do not take the government’s own advice into account.
The experience with Brisbane Airport’s flawed noise modelling in the 2007 MDP/EIS and since then has shown that:
- Communities are not easily able to translate decibel noise levels provided in an ANEF contour into a lived experience, and the comparisons are often flawed, e.g. “70 db = Passenger car at 60 km/h and 7m distance.”
- The level of noise nuisance is also impacted by the frequency of overhead flights, the topography, the difference between experienced ambient noise levels in residential areas and flight events, and whether any respite – if at all – is being afforded to residents. Brisbane Airport and Airservices have created an aviation super highway above Brisbane that provides for no respite whatsoever.
- Lay people do not easily understand the logarithmic units of the decibel measure.
BFPCA asks that all future airport master plans also include N65 and N60 contours as per the recommendations in the guidelines of the National Airports Safeguarding Framework 2016. We further ask that the real noise impacts beyond the small area indicated by the ANEF noise contours are being properly assessed and communicated to the community as the discrepancy between modelled noise forecasts and the lived experience is vast.
Register for the BFPCA protest:
Discuss this in the BFPCA Facebook group: