Excessive noise pollution from Brisbane Airport’s flight paths negatively impacts our city.
You shouldn’t need to be a pilot or air traffic controller to understand what’s going on in our city’s skies. Brisbane flight path noise is having a huge negative impact on our city, and the community should be able to easily understand and access accurate information – we stress: accurate – about flight paths and their noise levels.
This is the type of information published by Brisbane Airport, local, state and federal governments (based on so-called ANEF contours). Doesn’t look so bad, does it? Well…

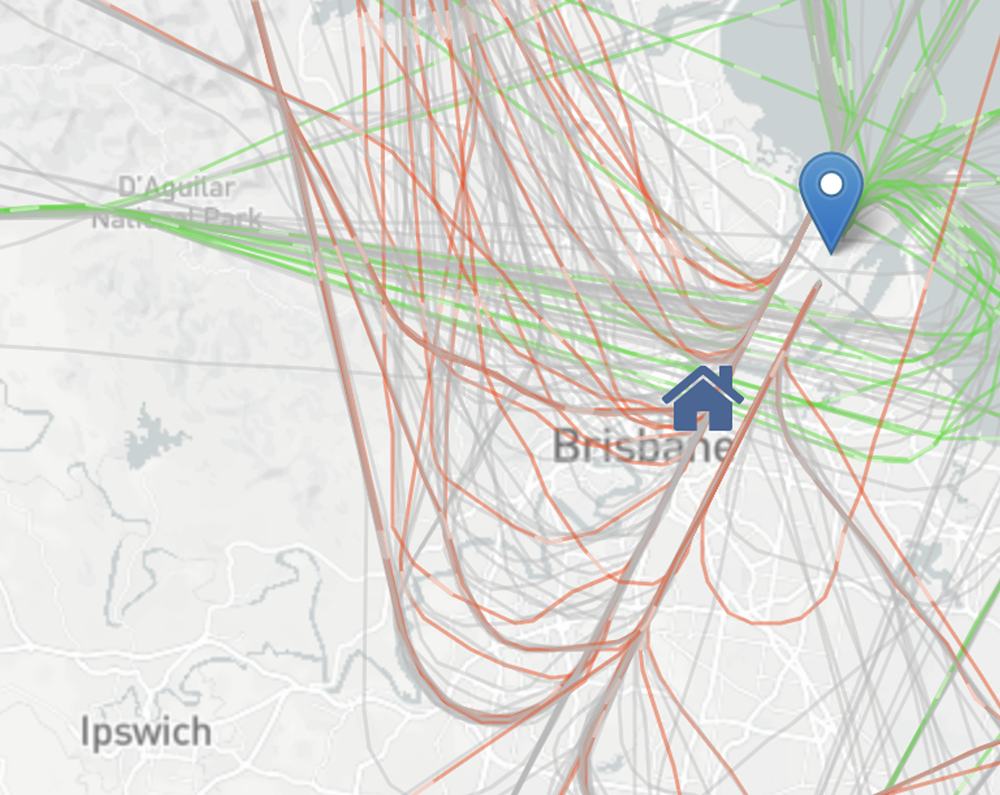
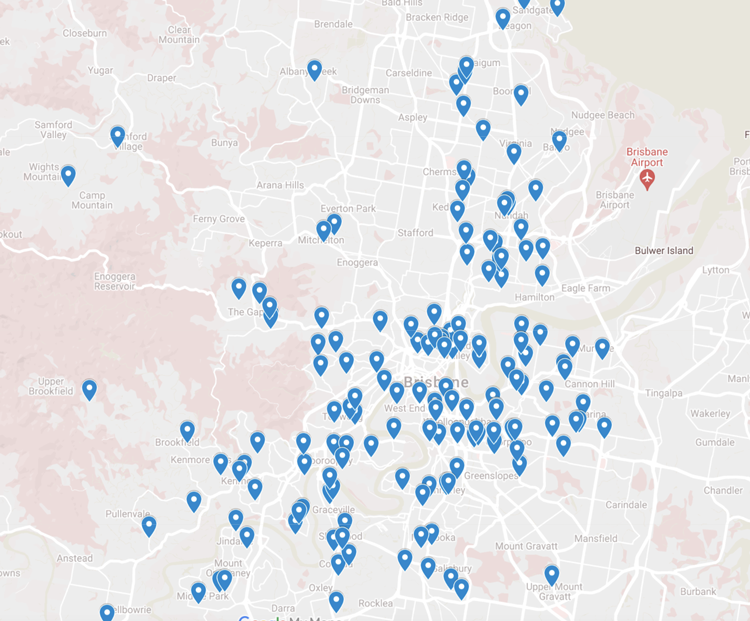
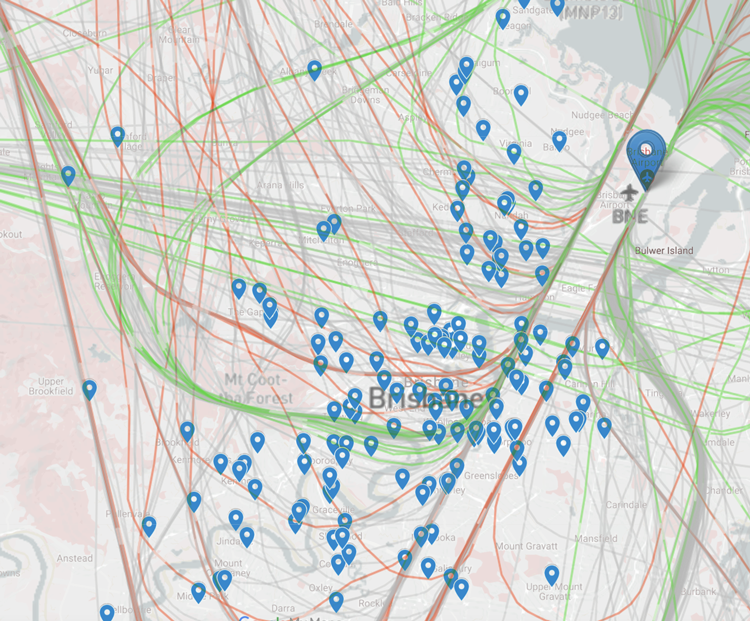
Compare this with the flight tracker map of where the planes are actually flying and causing excessive noise pollution across 220+ suburbs. This image is rendered by actual data from airplanes.live and shows the last 48 hours of flights over Greater Brisbane.

On this page you find three sections:
- Map comparisons to better understand the flight path’s impact
- The Flight Path Map BAC doesn’t want you to see
- Actually flown flight paths
- Flight paths on top of the federal electoral divisions
- Flight paths on top of primary and secondary schools
- Flight paths on top of the Wall of Shame
- Old vs New Flight Paths: North-Easterly Winds
- Old vs New Flight Paths: South-Westerly Winds
- Non-jet (turboprop) flight paths
- Flight path tools and online resources
- A suggested guide to using these flight path tools
1. Flight Path Map Comparisons
1.1 The Flight Path Map BAC doesn’t want you to see
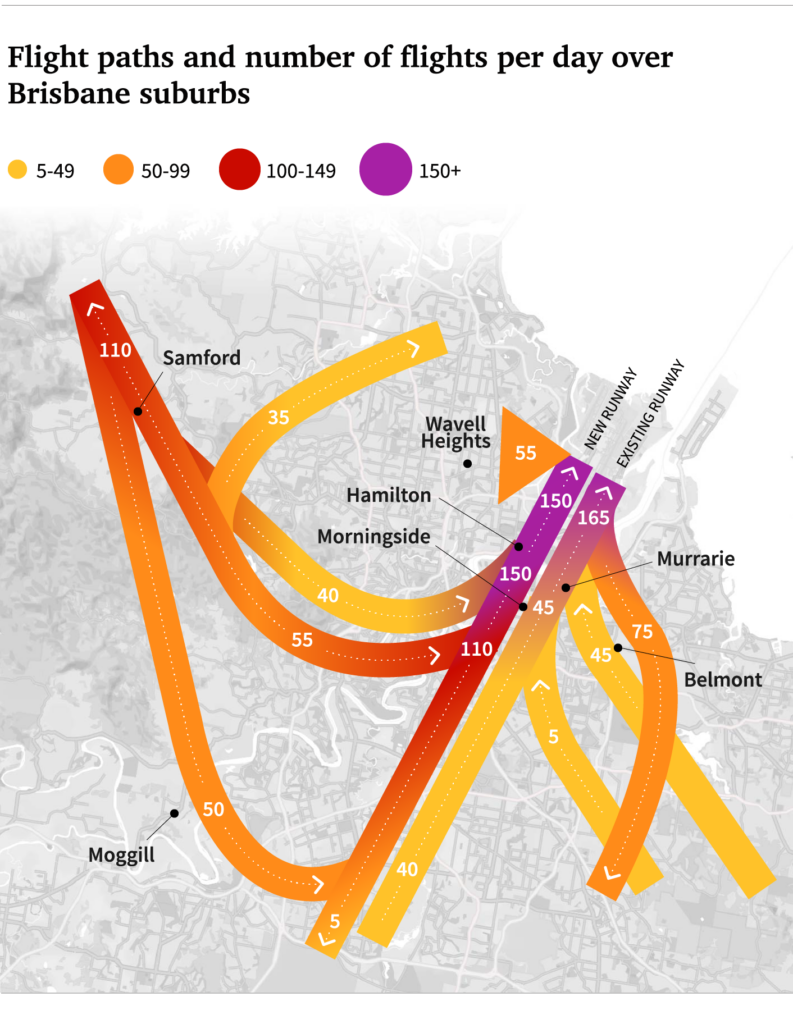
BAC fought hard to get approval for the New Parallel Runway (and without a curfew), but to reduce the community’s opposition they promised reduced noise and over the bay operations. BAC and Airservices then quietly dumped the ‘over the bay’ operating model and designed the flight paths to put hundreds of planes over Brisbane suburbs each day to maximise the airport’s capacity. These flight paths are above some of Australia’s most densely populated communities in a concentrated noise superhighway over 10 km long from the end of the new runway, before extending out over 30 suburbs all the way to Upper Brookfield, Pullenvale and Samford.
BFPCA have produced this map of Brisbane Airport’s flight paths, which for the first time shows how severe the noise is expected to be after COVID on one of the busiest flight corridors in Australia. BAC is expecting 150 flights per day on the superhighway after COVID. Most people never received any notice of the flight paths impacting their homes, and if they did, BAC has never revealed there would be anything like 150 planes per day.
For example, on its widely publicised online Flight Path Tool, BAC inextricably omit over 100 turboprop flights each day over the suburbs to and from the new runway. BAC has kept the forecast number of turboprop flights hidden from the public for over 15 years even though these aircraft typically have the same noise level as a Boeing 737. Even almost one year after the runway opened, the public are still waiting for BAC to come clean and provide accurate flight and noise forecasts for affected areas. As BAC failed to properly inform the public of the impact and consult transparently, we believe most residents under the flight paths still remain unaware that today they are only experiencing a fraction of the noise they can expect post COVID.
The map also debunks BAC’s claim that the new runway would more effectively share noise. The new flight path design is a long narrow tunnel that takes both inward and outward bound aircraft and does not comply with Airservices Australia’s own best practice principles to avoid this design. The legacy runway flight paths follow these principles to better limit the noise that any one resident experiences.
People can’t believe that $1.4 billion has been spent simply to move and concentrate the noise pollution 2km west, over a larger population and it hasn’t solved anything other than increase BAC’s profit. To make matters worse as the airport is one of the few airports in the world without movement caps and with no curfew, residents could soon be seeing flights every 2 to 3 minutes 24/7 around the clock. This is absurd in a community where operating a lawnmower has more noise controls than jet engines operating 24 hours a day. The health, social and economic damage will be disastrous unless the government starts to manage and properly regulate the aviation industry.
1.2 Actually flown flight paths
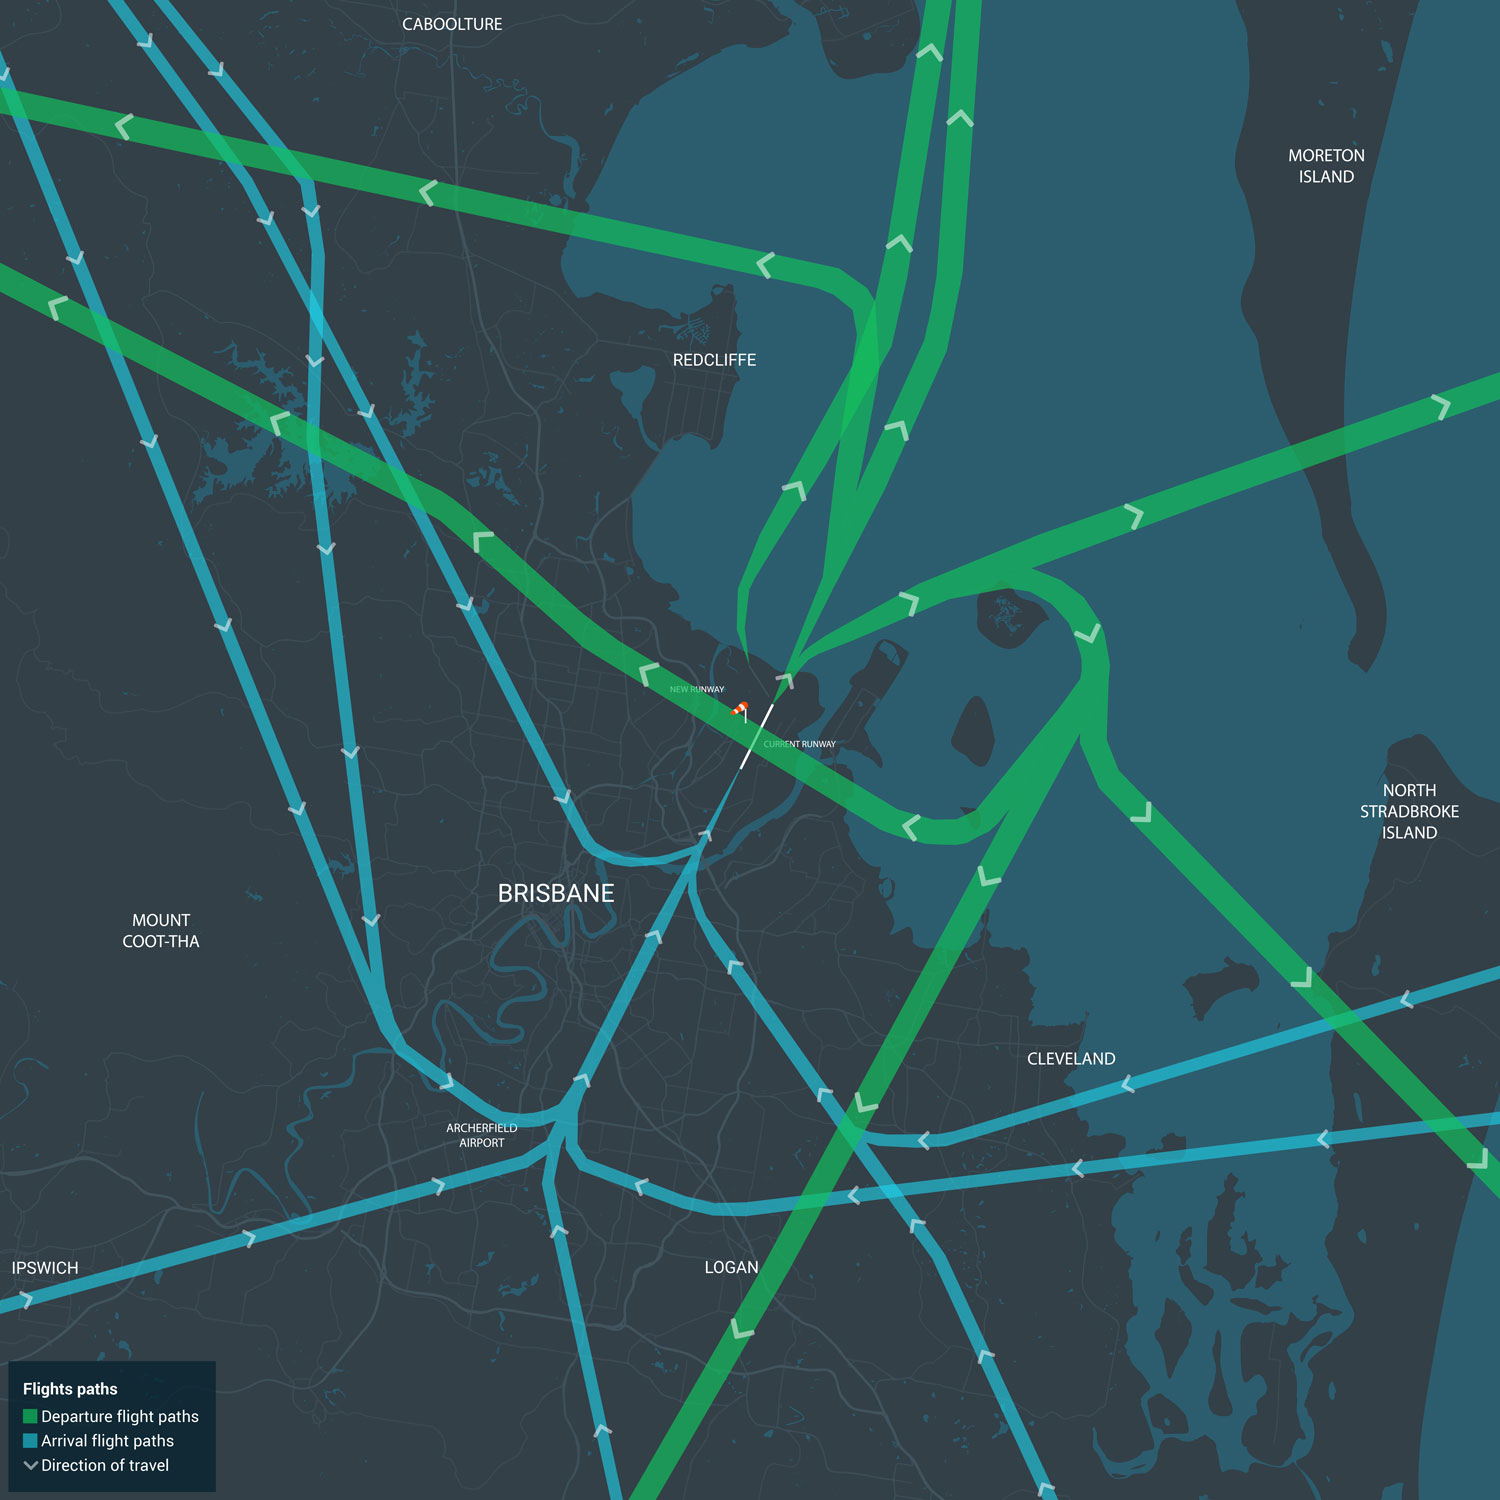
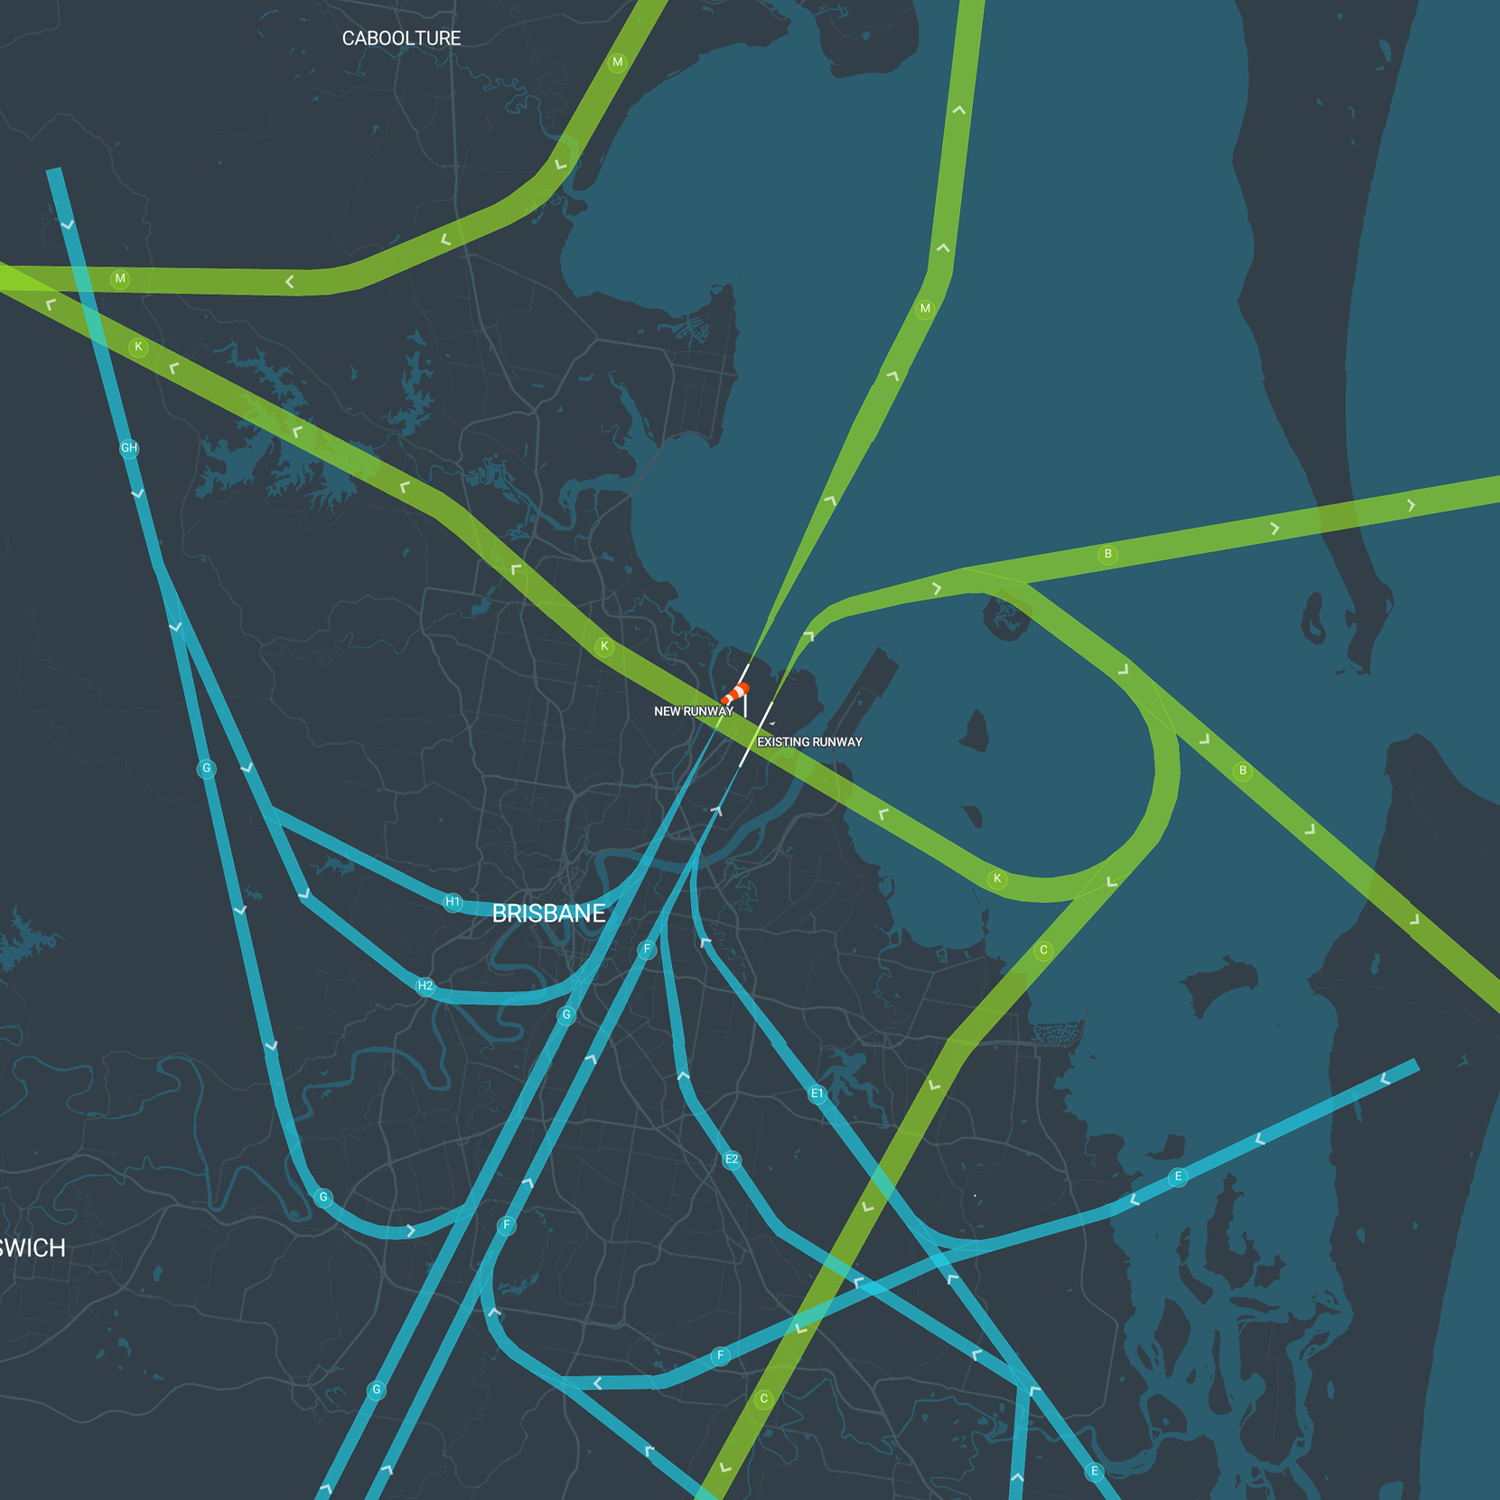
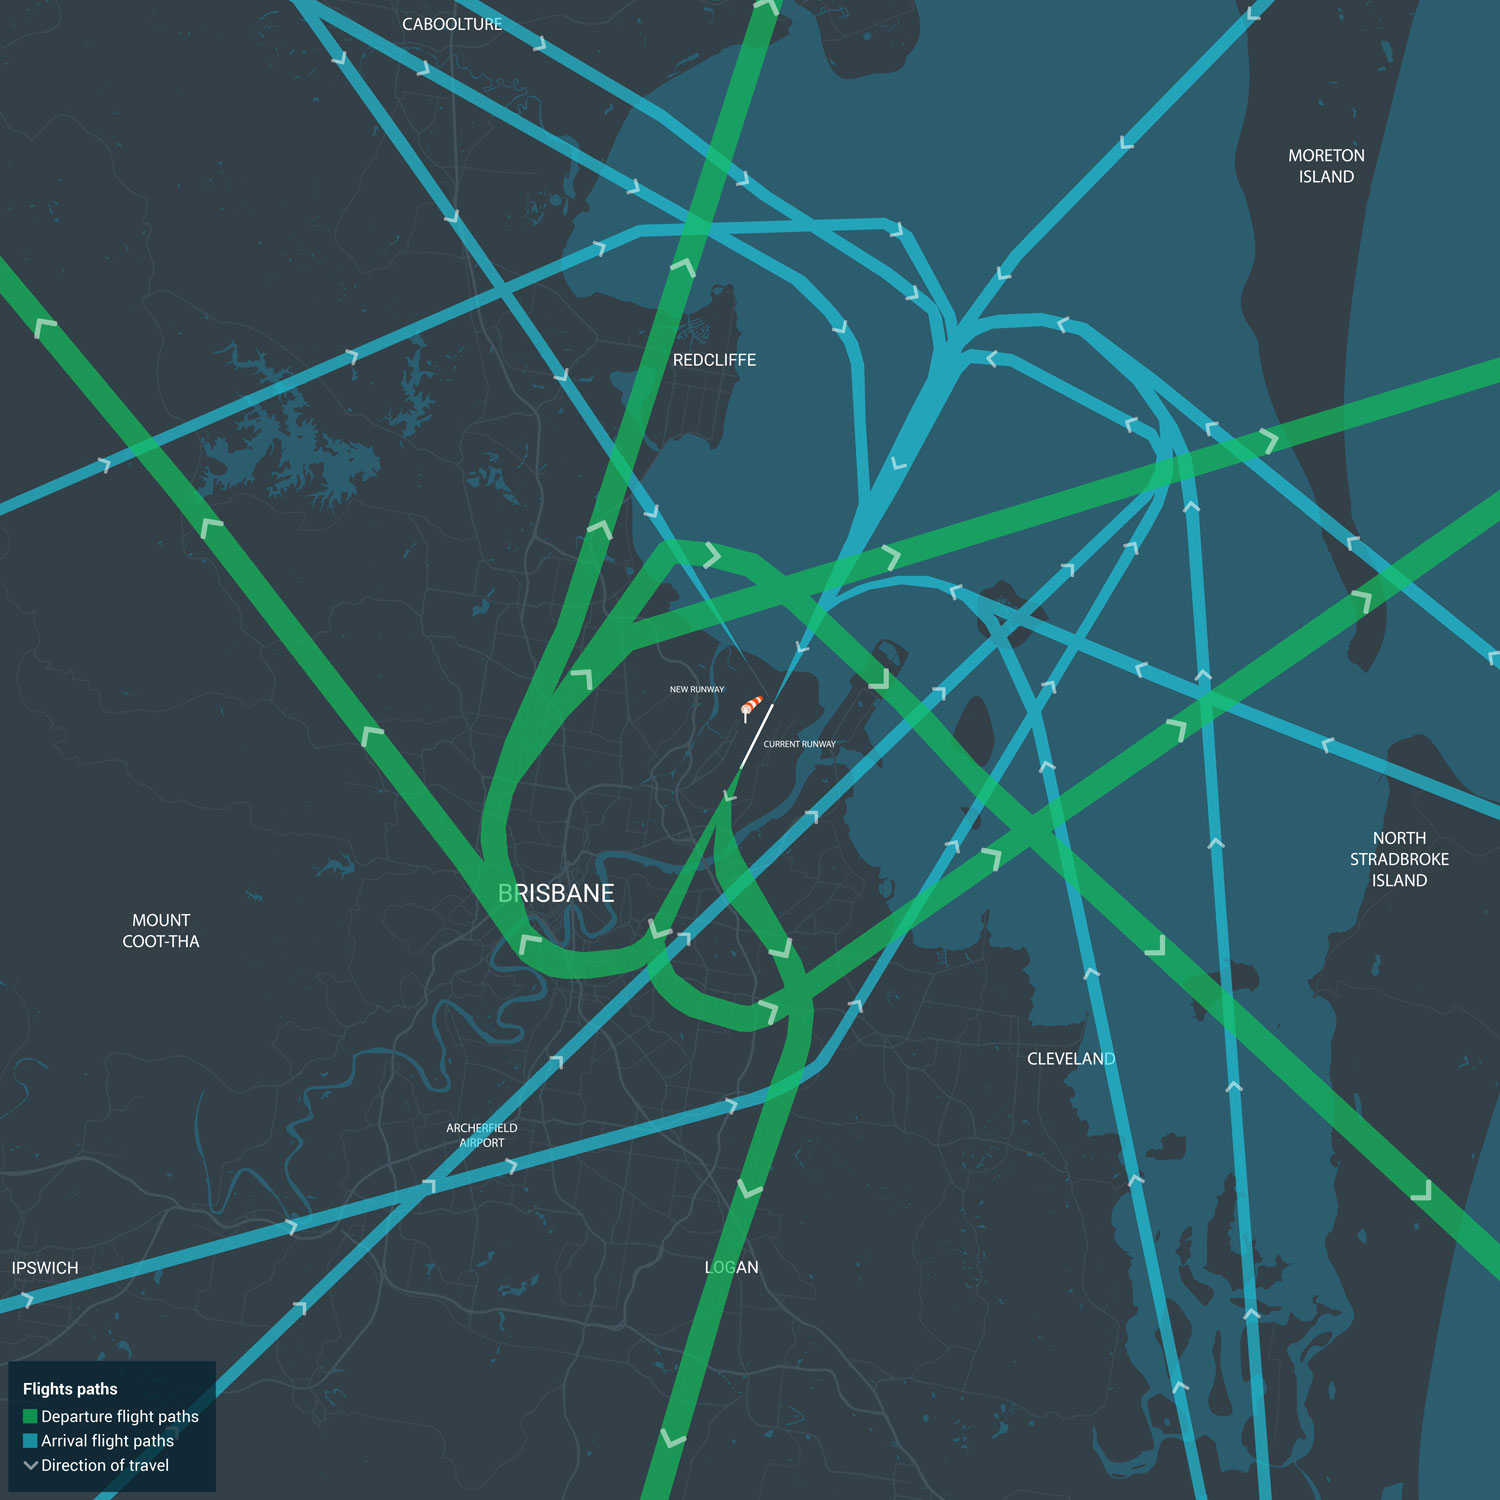
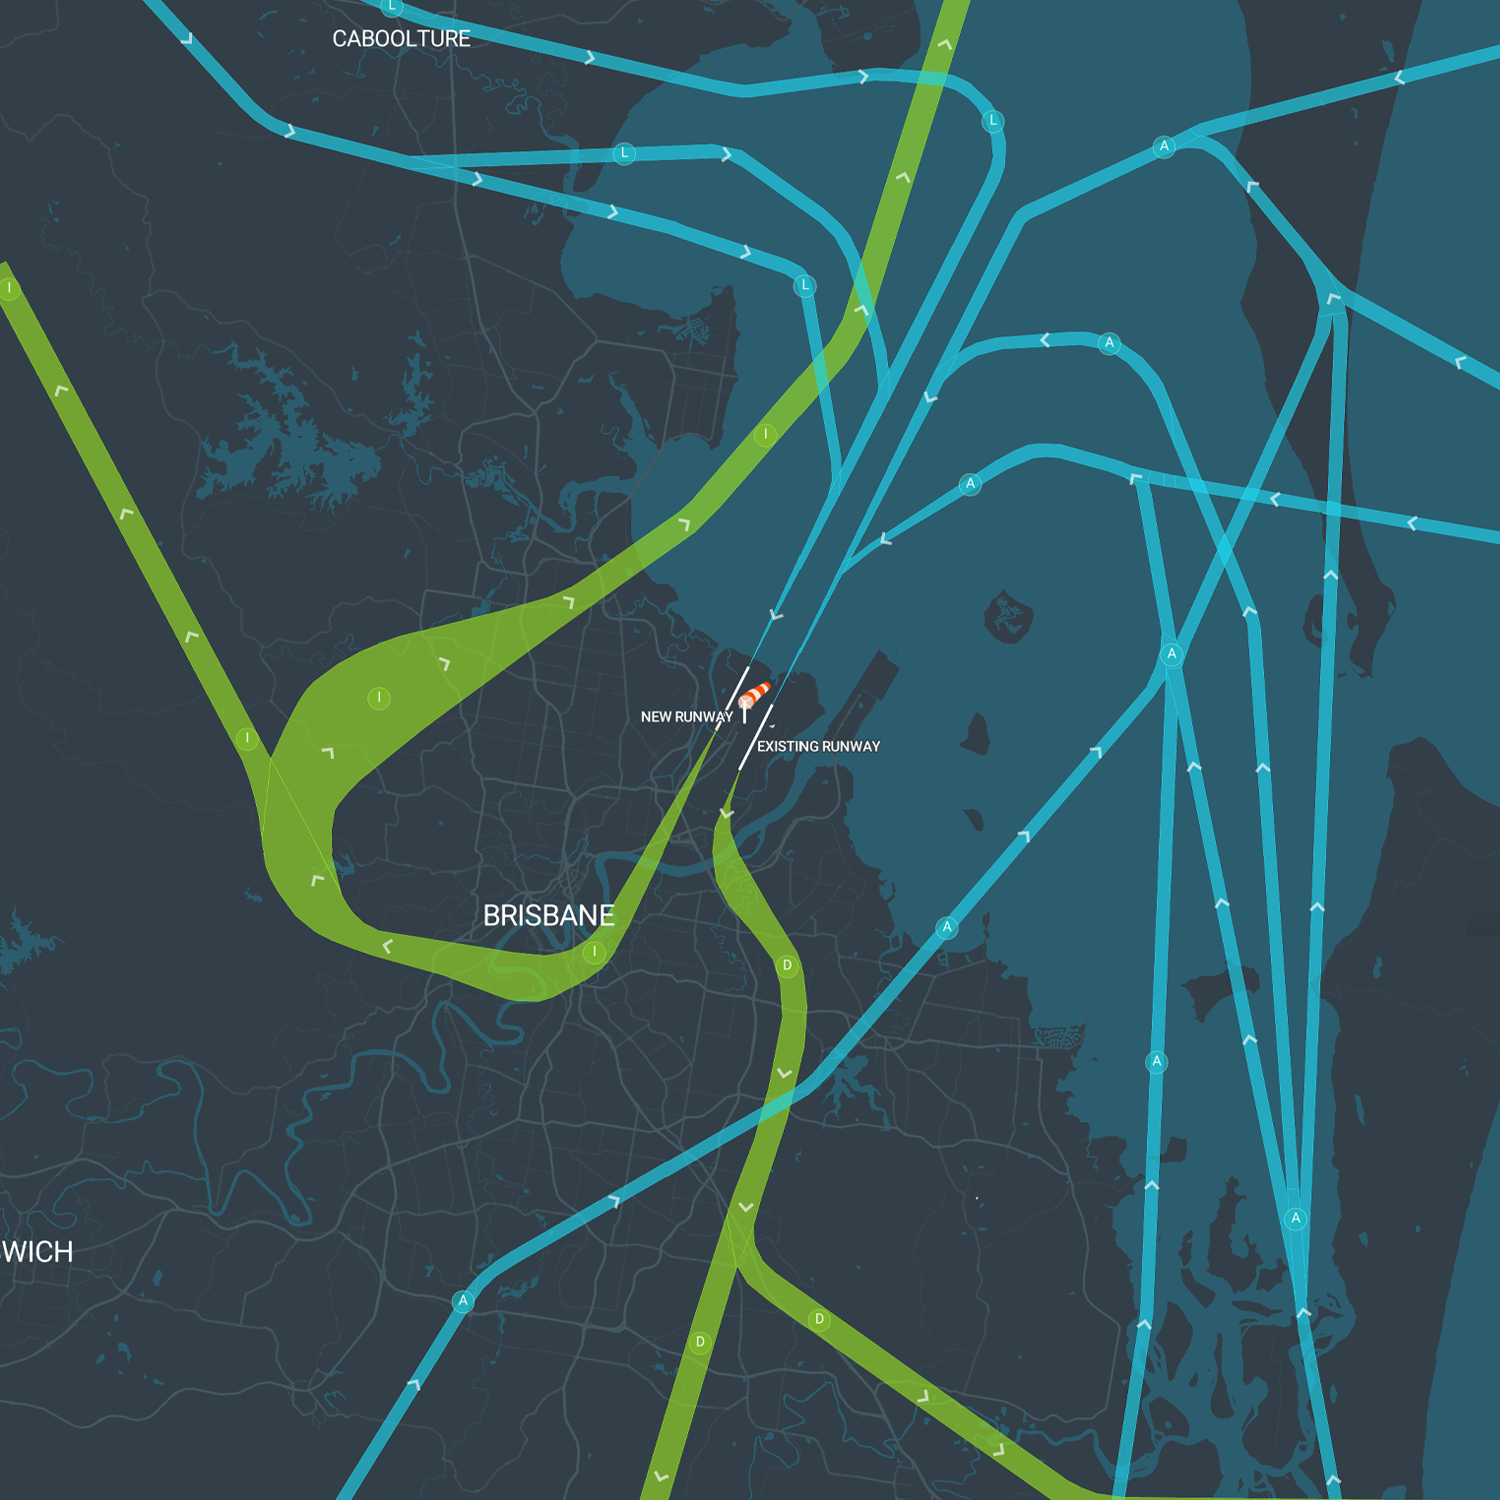
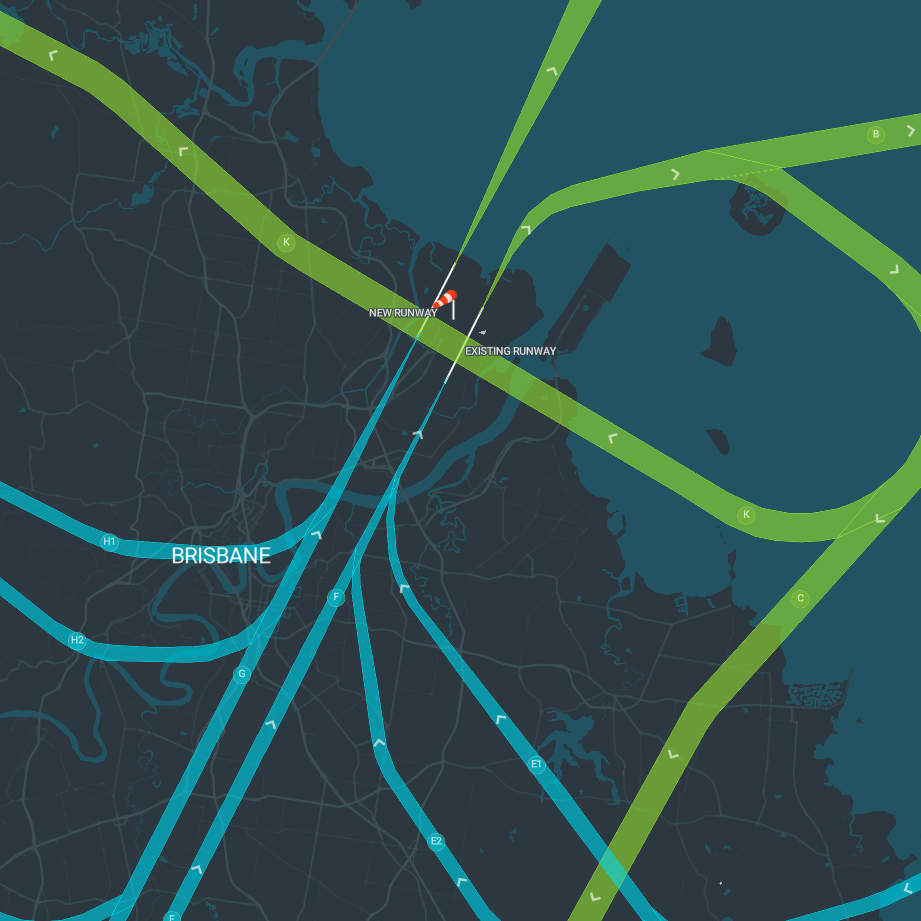
New flight paths commenced at Brisbane Airport on 12 July 2020. The images below show how aircraft typically operate following Brisbane Airport’s new runway opening in July 2020. The image on the left depicts flight paths of arriving aircraft (orange) and departing aircraft (green) when the winds come from the North East. The image on the right show operations with winds from the South West.

Animated version by Airservices:
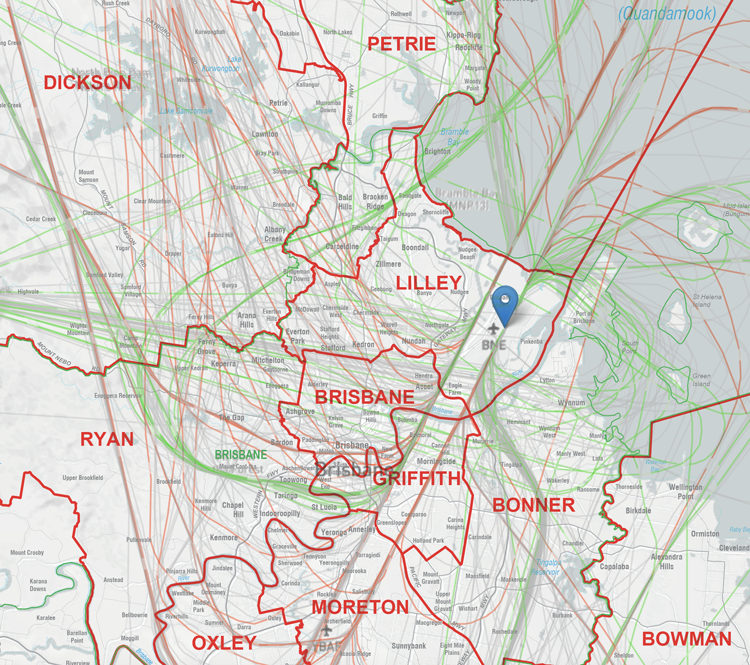
1.3 Flight paths on top of the federal electoral divisions
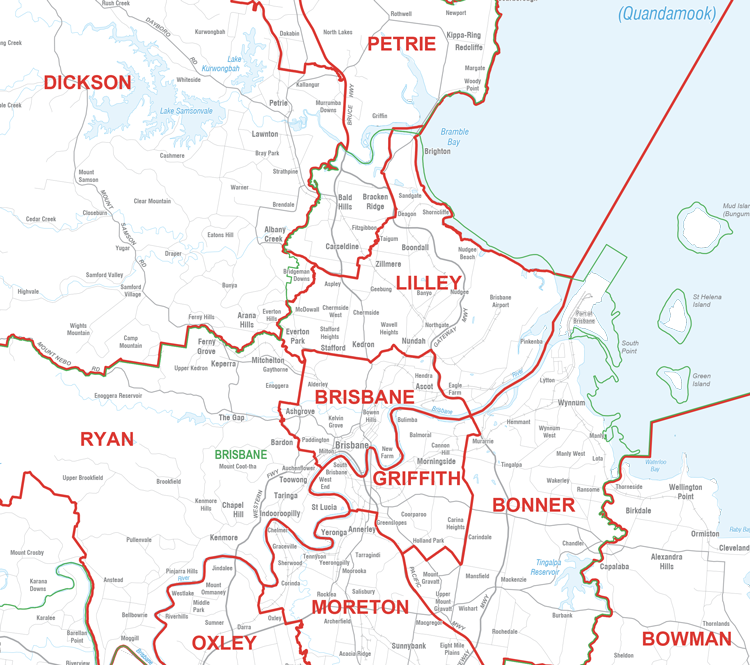
This map compares the federal electoral divisions across Greater Brisbane overlaid on top of actually flown flight paths sourced from Airservices Australia.
1.4 Flight paths on top of primary and secondary schools
Scientific evidence confirms that chronic aircraft noise impairs children’s cognition. Yet, more than 50,000 school children at more than 50 schools across Brisbane are learning underneath Brisbane Airport’s network of flight paths, according to new data analysis by Brisbane Flight Path Community Alliance (BFPCA). Read the full statement here.
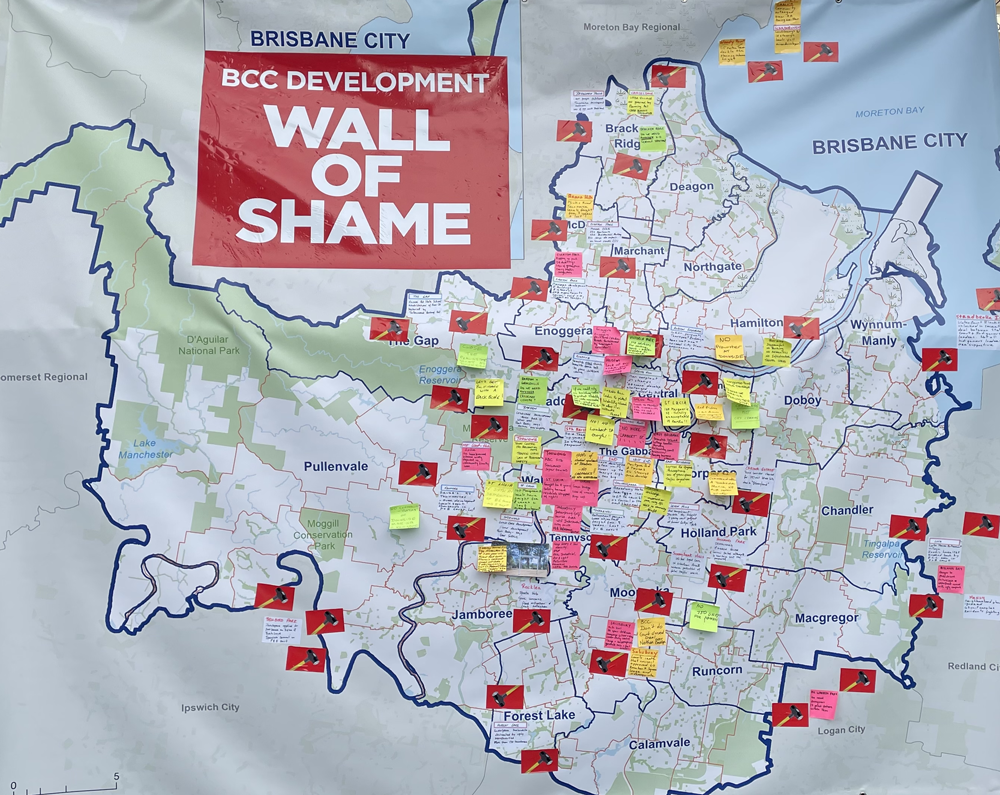
1.5 Flight paths on top of the Wall of Shame
BFPCA has joined forces with Brisbane Residents United and other community action groups such as Your Suburb, Your Say to expose a widespread lack of genuine community engagement and unsustainable development as a result both on the ground and in the air. This map comparison shows the “Wall of Shame” courtesy of Say No More on the left, and Brisbane’s actual flight path density map on the right.

1.6 Old vs New Flight Paths: North-Easterly Winds
Many residents asked for a simple comparison between old flight paths prior to 12 July 2020 (left) and new flight paths (right) since the launch of the New Parallel Runway at Brisbane Airport. Such a simple comparison is actually nowhere to be found but here.
1.7 Old vs New Flight Paths: South-Westerly Winds
Same as above, but these images show the old vs new flight paths for South-Westerly Winds.
1.8 Non-jet (turboprop) flight paths
BAC have largely omitted to show the impact of turboprop flight paths and numbers in the 2006 EIS and in their Flight Path Tool. On another section of the BAC website, you can find out more about turboprop flight paths.

2. Flight Path Tools and Resources
BNE Flight Path Tool
The Brisbane Airport flight path tool shows the jet arrival and departure flight paths from Brisbane Airport. The tool also provides a noise mapping tool, though our experience shows that this map (also called a noise contour map) is not accurate.
Brisbane Airport Corporation also provides more information about flights paths and noise here. However, BFPCA has received many reports and has first hand experience of how this information is not accurate and downplays or misrepresents the true impact of noise on properties under and adjacent to flight paths.
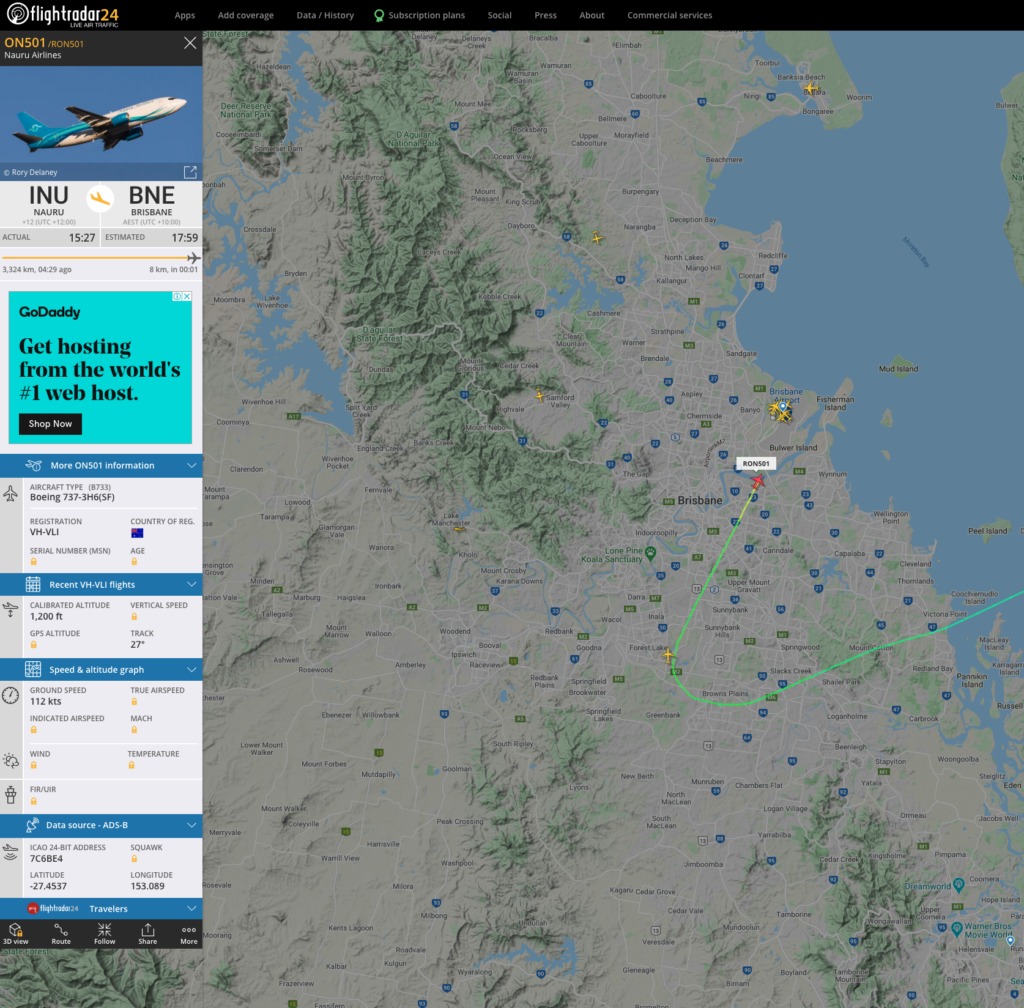
Flight Radar 24
Flightradar24 is a global flight tracking service that provides you with real-time information about thousands of aircraft around the world.
This is a great tool to see which planes are coming in and to see the flight paths in operation. It also helps you understand which plane models are louder than others. Importantly, this tool also provides data on plane altitudes in real time, which is also really useful to understand the true impacts of the flight paths compared to the more general information provided by Brisbane Airport Corporation.
Flight Radar 24 is available both through web browsers and as an app for your phone. You can find additional recommended tools on our FAQ page.
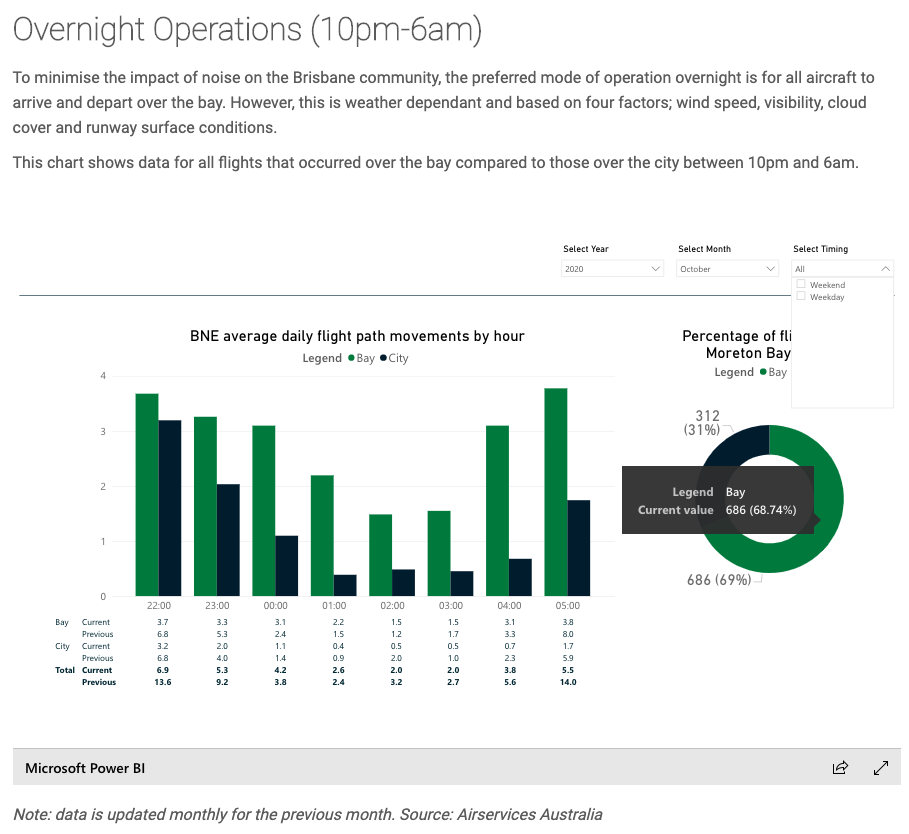
Runway Operations Statistics
Brisbane Airport Corporation provides a number of dashboards that show data related to the operation of its runways.
These statistics are not real time, but they are useful in understanding and predicting plane movements and runway operations.
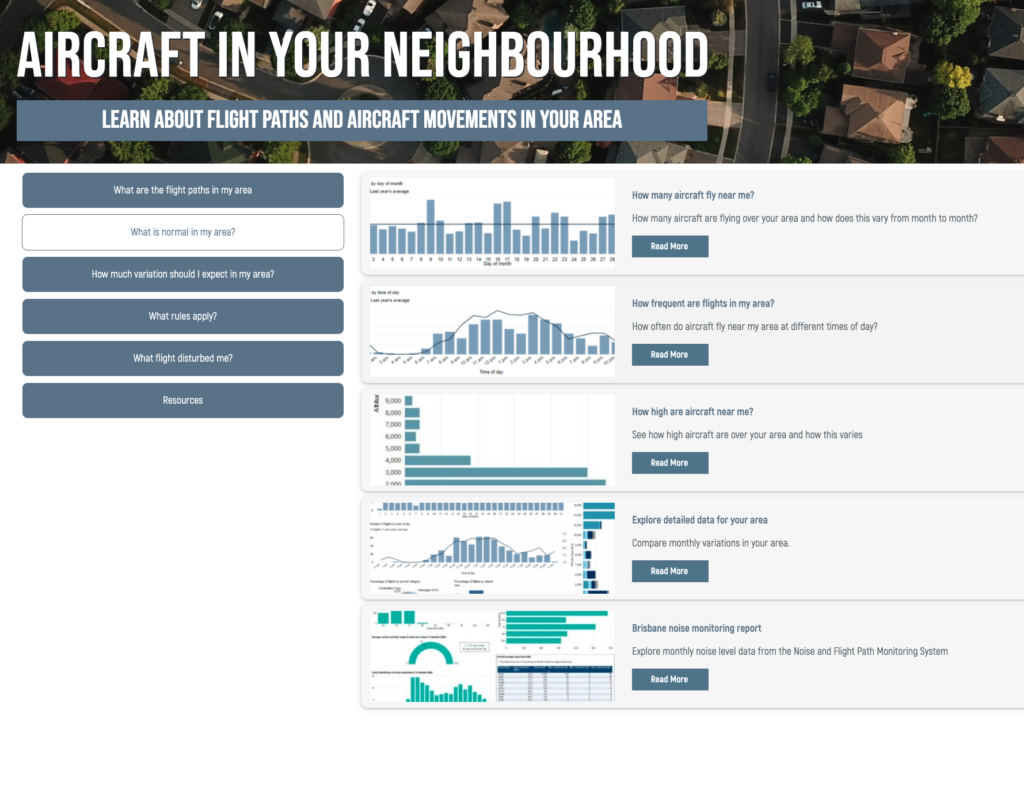
Aircraft in Your Neighbourhood
Aircraft in Your Neighbourhood is a tool provided by Airservices Australia that aggregates the information about flights in Australia’s Airspace. You can tailor this to your region by entering your address or dropping a pin on a map.
The most valuable information is under the ‘What is normal in my area’ tab. Here you will find the data on flight volumes, frequency, altitude and, most importantly, noise.
3. Guide to using these flight path tools
There is so much data, some of it is technical and hard to follow. And… it’s spread out across multiple pages and tools. It’s hard to understand and it shouldn’t be. Obstacles to understanding the impacts of the flight paths are one of the major problems BFPCA has identified that has made the impacts of the Brisbane flight paths worse.
We suggest the below steps as a way to approach and draw the right information out of these tools as a start. Once you’re familiar with the tools, play around! Maybe you’ll find something we missed.
- Step 1 – predictions:
Go to https://flightpathtool.bne.com.au/bac/map and switch to “Show Noise Mapping,” then select your suburb. Scroll down to “view all data” and look for the column “With new runway.” - Step 2 – actuals:
Go to https://aircraftnoise.airservicesaustralia.com and click on the “Your Location” button (top right). Then select “What is normal in my area?” on the left, and “Brisbane noise monitoring report” from the list (last item). The next screen is best viewed full screen. Select your suburb from the drop down menu.
Using this approach, we have prepared an example below.
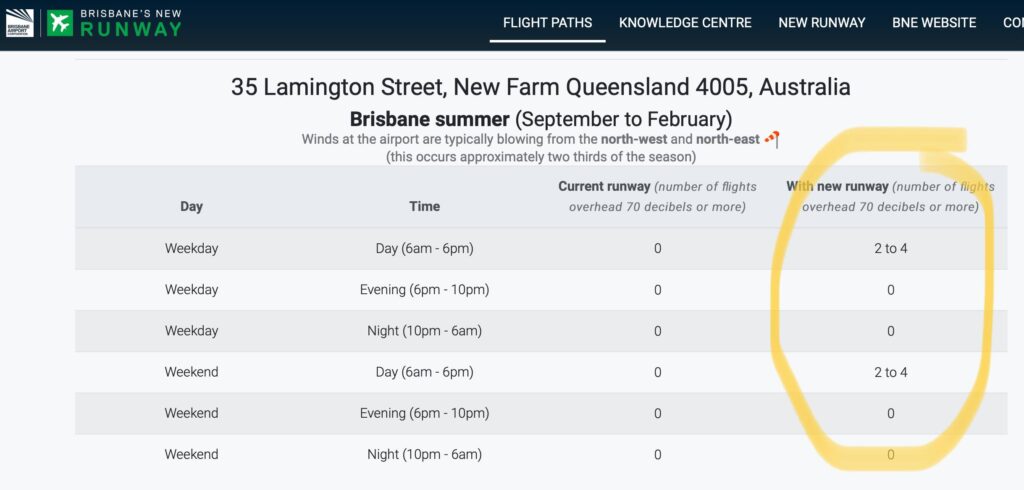
The information above from Brisbane Airport Corporation shows that New Farm can expect 2 to 4 flights a day that exceed 70 decibels.
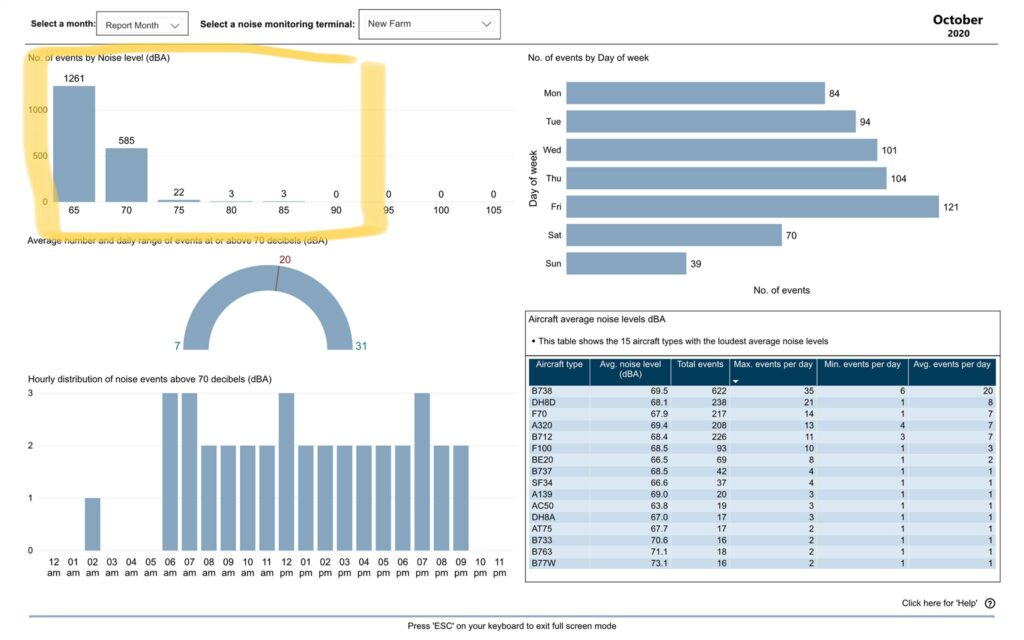
The actual data above from Airservices Australia shows that, in fact, over New Farm in October of 2020 there were:
- 1,261 at 65dB;
- 585 at 70dB;
- 22 of 75dB;
- 3 of 80dB;
- 3 of 85dB.
So in fact, New Farm experienced approximately 20 flights a day of 70+dB or more in the month of October 2020.